Daikibo Industrial Data Analytics & Forensic Analysis
Deloitte Data Analytics Job Simulation | Tableau | Excel | Data Visualization
Project Overview
- This project was completed as part of the Deloitte Data Analytics Job Simulation. The project involved analyzing real-world-style business datasets provided by Daikibo Industries to identify operational issues and investigate gender pay equality.
- Using Tableau and Excel, I analyzed industrial telemetry data to identify which factory experienced the highest machine downtime and which machine types contributed most to the downtime.
- I also analyzed employee compensation data and classified gender pay equality scores into different levels to help identify potential pay disparities.
- The project demonstrates practical skills in data analysis, data visualization, calculated fields, dashboard creation, business insights, and forensic analysis.
📊 Daikibo Industrial Data Analytics
Deloitte Data Analytics Job Simulation
An end-to-end data analytics project analyzing industrial telemetry and employee compensation data. I used Tableau to investigate factory downtime and machine failures, and Excel to classify gender pay equality scores.
🔧 Task 1 — Factory Downtime Analysis
Business Question
Which Daikibo factory experienced the most machine downtime?
Approach
I analyzed telemetry data collected from four Daikibo factories:
- Daikibo Factory Seiko — Osaka
- Daikibo Factory Meiyo — Tokyo
- Daikibo Factory Berlin — Berlin
- Daikibo Factory Shenzhen — Shenzhen
Each machine generated telemetry messages at regular intervals.
To estimate potential downtime, I created a Tableau calculated field called Unhealthy.
Calculated Field
IF [Status] = "unhealthy" THEN 10 ELSE 0 ENDEach unhealthy telemetry message represents 10 minutes of potential downtime.
Visualization
Created an interactive Tableau bar chart:
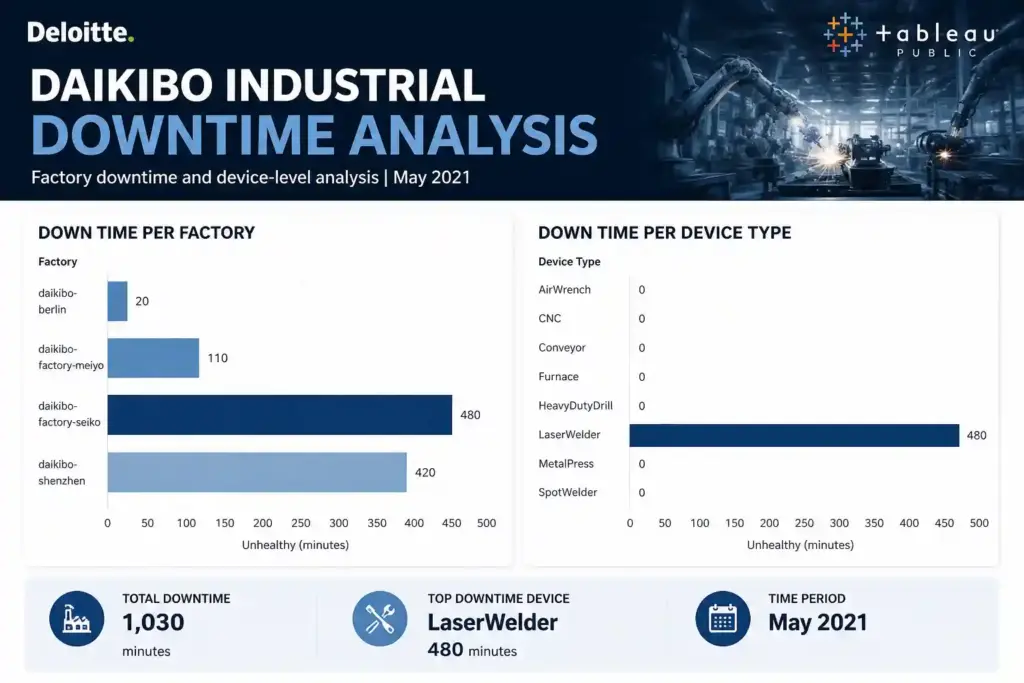
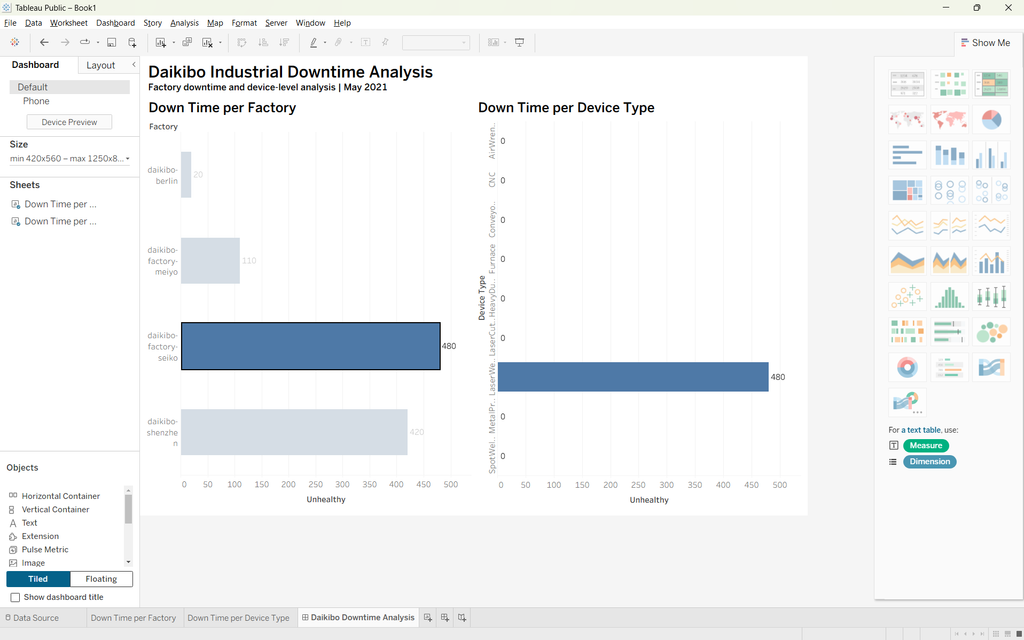
Down Time per Factory
Key Finding
Daikibo Factory Seiko recorded the highest potential downtime at 480 minutes.
🔧 Task 2 — Machine Failure Analysis
After identifying the factory with the highest downtime, I filtered the analysis to Daikibo Factory Seiko.
I then analyzed downtime by machine/device type using the Tableau visualization:
Down Time per Device Type
Key Finding
LaserWelder was responsible for the highest potential downtime, with 480 minutes.
This helped identify the machine type that should receive priority for further investigation and maintenance.
⚖️ Task 3 — Gender Pay Equality Analysis
The second part of the project focused on analyzing Equality Scores across different factories and job roles.
The Equality Score ranges from -100 to +100, where 0 represents ideal equality.
I created an Equality Class to categorize the scores.
| Equality Score | Equality Class |
|---|---|
| -10 to +10 | Fair |
| -20 to -11 or +11 to +20 | Unfair |
| Below -20 or above +20 | Highly Discriminative |
Purpose
This classification makes it easier to identify job roles and locations with significant compensation disparities and areas that may require further investigation.
🛠️ Skills & Technologies
Technical Skills
- Tableau Public
- Microsoft Excel
- Data Analysis
- Data Visualization
- Calculated Fields
- Interactive Dashboards
- Data Filtering
- Business Intelligence
- Exploratory Data Analysis
- Forensic Data Analysis
⭐ Portfolio Project Card
Daikibo Industrial Data Analytics
Analyzed industrial telemetry and employee compensation data as part of the Deloitte Data Analytics Job Simulation. Built interactive Tableau dashboards to identify factory downtime and machine-level failures, and used Excel to classify gender pay equality scores.
Tools:Tableau Public · Excel · Data Analysis · Data Visualization · Dashboard Development
Key Results
480 min — Highest factory downtime
LaserWelder — Highest downtime device
4 factories — Analyzed
Gender pay equality — Classified across roles and locations